5 Bright Data Alternatives for Web Scraping
2024-04-02We have listed the 5 Best Bright Data Alternatives for Web Scraping.
We have listed the 5 Best Bright Data Alternatives for Web Scraping.
In this blog, I have scraped Airbnb data with the help of Python.

We have described the legality issues, challenges that might occur when scraping LinkedIn.
This is a complete tutorial for building a web crawler using javascript and nodejs
In this blog, we have scraped the job portal Indeed with Python.
In this blog, I have illustrated how you can use google sheets for scraping data from a website. Further, there are some limitations to this process, I have listed ways to overcome them.
In this blog, we have explained what search engine scraping is. What are the challenges in scraping search engines, its use cases and finally some tools to do it.

In this article, we will learn how to build an Amazon price tracker using Python, to keep an eye on our favorite product. When the price drops, the system is built to send us alerts.
In this comprehensive tutorial we are going to scrape twitter with Python & Selenium.
In this post, we have defined what is price scraping, challenges to it and best tools to do it.
In this post, we will learn to scrape websites using puppeteer & proxies.

In this tutorial, we are going to extract data from a business listing on Yelp using Python.
In this post, you will get to know which are the best data scraping tools
In this blog, we will be scraping product details from Myntra using Selenium and Python.
Web scraping is a useful tool when you want to gather information from the internet. For those in the hotel industry, knowing the prices of other hotels can be very helpful. This is because, with more hotels & OTAs coming into the market, the competition is rising at a faster pace now! So, how do […]
We have curated list of 9 best google search result scraper APIs.
We have curated a list of best twitter scraping APIs available in the market.
In this blog, we will use Python for scraping Redfin.com. Further, we will see how we scale data extraction process form Redfin.

In this blog, we have explained how to use proxy with axios and nodejs.
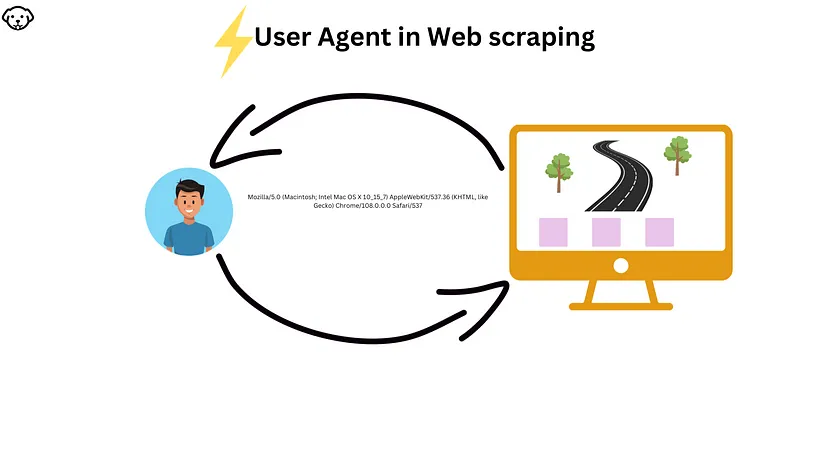
In this blog, we have discussed what user agents are and how to use them effectively in web scraping.

In this post, we are going to scrape property data from idealista using Python.
In this post, we are going to scrape job postings using Ruby and Nokogiri.

In this post, we are going to scrape and then parse the HTML using Regex.
In this blog, we have described how you can use web scraping for generating leads.
In this post we will be using Nodejs to web scrape. This is a comprehensive tutorial.
In this post, we will learn to scrape websites using R and other libraries.

Web Scraping has become very common nowadays days as the demand for data extraction has gone up in recent years. Pick any industry and you will find one thing in common and that is web scraping. But web scraping at scale can be a little frustrating as many websites around the world use on-screen data […]
In this post, you will learn about top 5 JavaScript libraries for web scraping
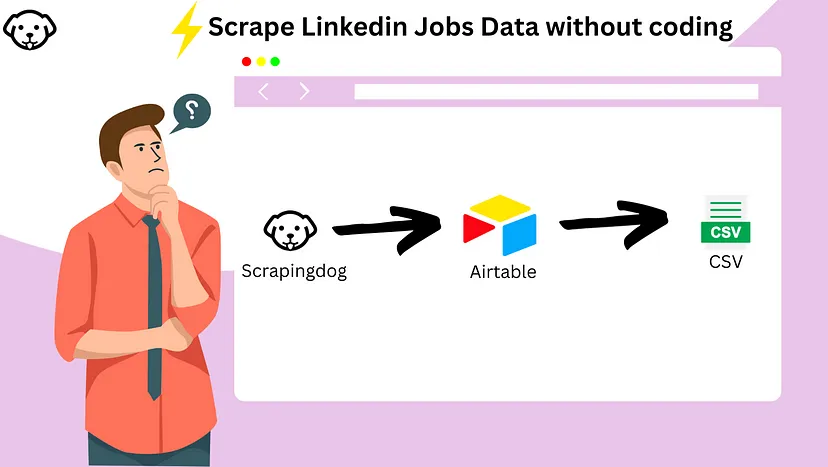
We will be scraping LinkedIn jobs in this post without using any programming language and coding skills.

In this blog, we have scraped google map reviews using beautifulsoup and playwright library.
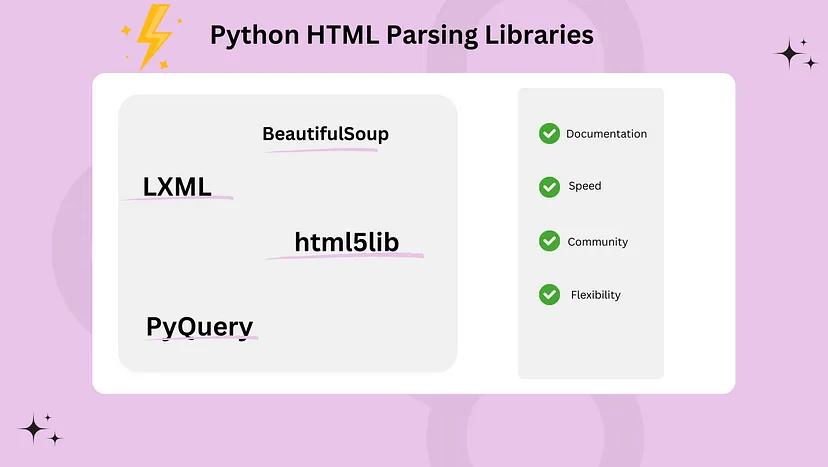
We have listed the top python html parsing libraries in this blog.

In this post we will talk about how to send post request with Python.

In this article, we have scraped stock market data from google finance.
This is a complete guide on datacenter proxies.
In this blog, we have discussed how you can web crawl using Python.
In this article, we will learn to create a web scraper using csharp and selenium.

In this post we have scraped Zillow via Python. Scraping Zillow gives you property rates in a particular area.

We have discussed 4 best html parsing libraries in JavaScript. Further, discussed advantage & disadvantage of using each.
In this blog, we have discussed how you can scrape LinkedIn profiles using Python.
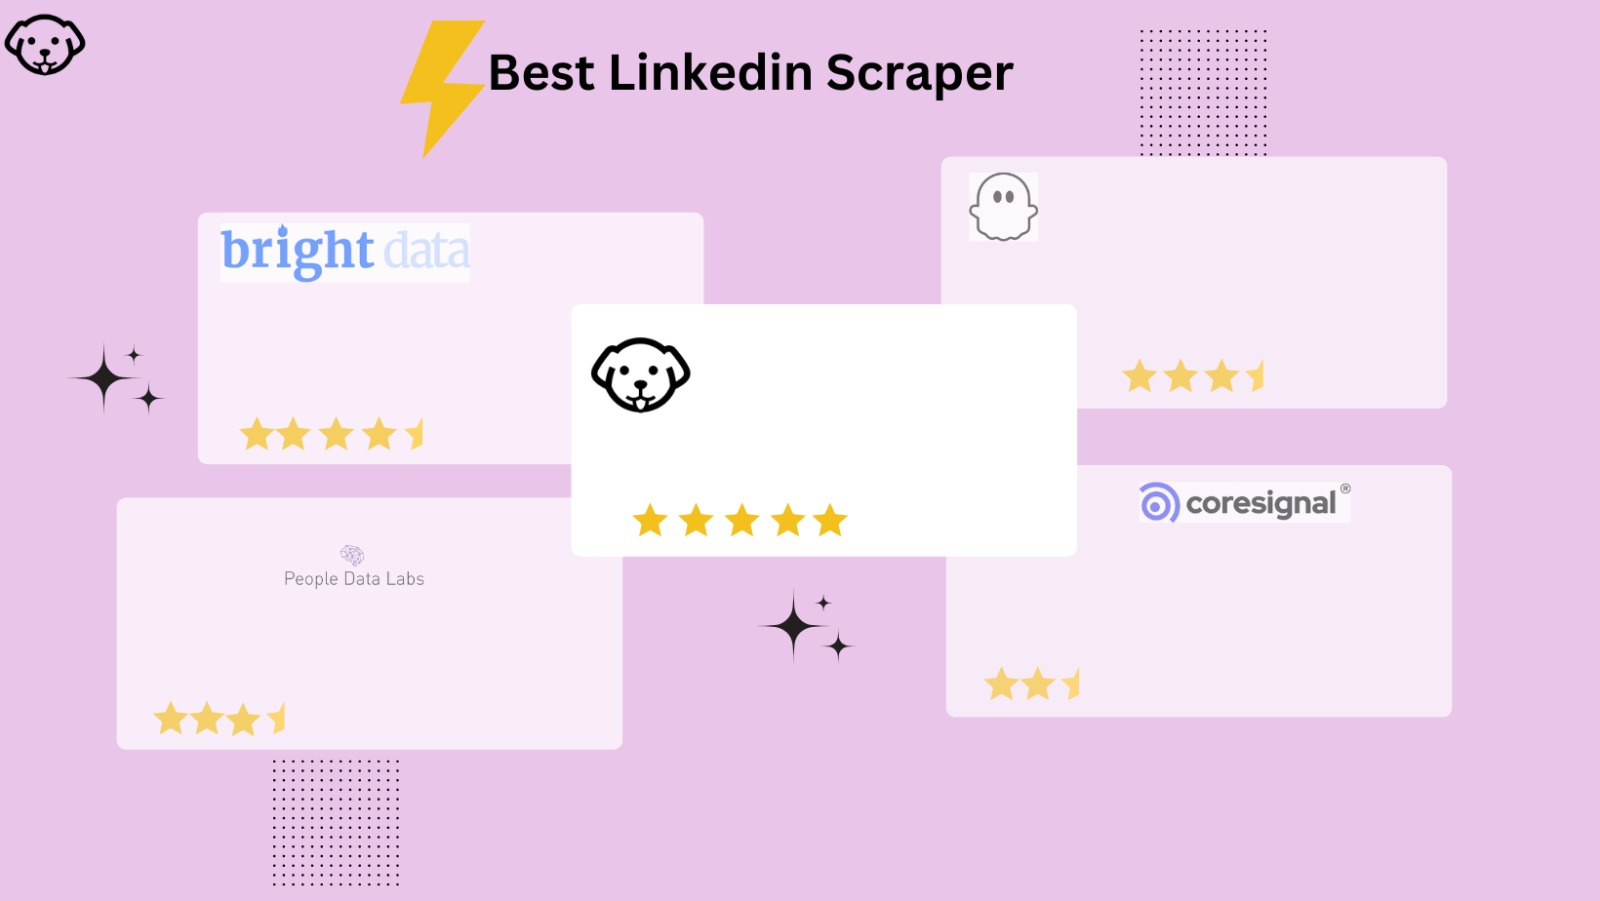
We have curated a list of best LinkedIn scrapers available in the market in 2023
Web Scraping Glassdoor Job listing using python
In this post, we are going to learn the concept of Xpath for scraping web pages using Python.
In this blog we will learn to use a proxy with Python requsts.
web scraping yellow pages for business data.
In this blog, we are going to scrape linkedin Jobs using python
In this post we will be using python to scrape zoominfo

Tutorial on Using Scrapingdog’s LinkedIn Scraper API
In 2024, the best language for web scraping will be the one that is best suited to the task at hand. Let’s explore their strengths and limitations.

We will be scraping ebay in this tutorial using Python.
In this post we are going to scrape expedia using Python.
In this post, you will learn to Scrape dynamic websites using Selenium and Python

This Article dig downs on best http ruby clients in 2023.
This blog explains how you can scrape amazon using python.
In this post, we are going to scrape yelp reviews using python.
In this Post, we will scrape walmart data using python

In this post we will scrape Google Search results using Python.
You will learn scraping with all the python libraries.
cURL is a command-line library that is used for transferring data using multiple protocols such as FTP, HTTP, SMTP, IMAP, TELNET, etc. You can use it to download files, upload files, and test APIs. Features of cURL: cURL can be used on any operating system such as Windows, MacOS, Linux, etc. cURL is already installed in all the operating […]
In this post we will learn about java web scraping using libraries and tools. We will cover topics like htmlunit, jsoup, and webmagic.

In this post, we’ll learn how to use web Scraping APIs to scrape Amazon.com in just 5 minutes.

In this blog, we have scrape yahoo finance stock market data using python.
See what’s the difference and similarity between web scraping and API.

In this post, we are going to extract property data from realtor.com using python.
Discover the best libraries and techniques for web scraping with Rust and get hands-on examples to help you get started
In this blog we are going to extract email address from a website using python.
Learn all about web scraping – the process of collecting and gathering information from the internet automatically. Understand the benefits and applications of web scraping, including price comparison, data analysis, and sentiment analysis. Be aware of ethical and legal concerns associated with web scraping, and explore techniques and tools for effectively extracting data from websites.
In this post we will talk about top 10 datacenter proxy provider for web scraping
Learn the difference and applications of web scraping and data mining.

In this blog we have listed some use cases of web scraping.
Extracting data from a website can be a useful skill for a wide range of applications, such as data mining, data analysis, and automating repetitive tasks. With the vast amount of data available on the internet, being able to get fresh data and analyze it can provide valuable insights and help you make informed & […]
Web Scraping is incomplete without data extraction from the raw HTML or XML you get from the target website. When it comes to web scraping then Python is the most popular choice among programmers because it has great community support and along with that, it is very easy to code. It is readable as well without those […]
We will understand the difference between web crawling and scraping.
In this post, we are going to web scrape using node unblocker which is a nodejs library for scraping web.
In this post, we are going to scrape Bing search results using Python and web scraping API Scrapingdog.
In this post we are going to scrape Nasdaq to extract stock market data.

Python scripts and spiders are great for web scraping automation and reducing recurring efforts. A complete guide on getting started.

Web scraping for lead generation can help you get the information you need to succeed. Let’s learn it step-by-step with this simple yet effective guide.

Web scraping can have various purposes. Here’s the ultimate guide for web scraping for market research and how to automate your research.
In this post, we will learn to scrape websites using Golang & Gocolly.
The best python web scraper would be one that can extract data from websites quickly and efficiently. Learn how to use BeautifulSoup, Scrapy, Selenium, and Requests at best.
In this post we will learn web scraping using php.
In this post we will talk about top 5 free proxy list providers.
In this post we will talk about web scraping using scrapy & proxy to beat Captcha.

In this post, we are going to scrape data behind authentication using python.

Puppeteer is a Node library API that allows us to control headless Chrome. This guide explains how to implement puppeteer web scraping.

In this post, you will learn to learn 10 tips to avoid getting Blocked while Scraping Websites
© 2023 Scrapingdog. All rights reserved.